Disease Bioportal
Project Overview
The Disease BioPortal dashboard provides data to researchers, veterinarians, and farmers interested in tracking and analyzing disease outbreaks in livestock.
Currently, researchers at BioPortal are interested in expanding the data they collect and provide through their platform, particularly with a view toward making predictive assessments of outbreak events. The DataLab worked with project partners Beatriz Martinez (Vet Medicine) and Xin Liu (Computer Science) to incorporate two new capabilities into BioPortal: the first, regularly updated weather data for selected geographies to check for potentially outbreak-inducing weather conditions, and the second, live monitoring of social media posts to watch for early warnings of developing outbreaks. The project work started on January 4th, 2021.
The National Science Foundation awarded BioPortal a Phase II grant in late 2021, enabling the project to further develop and expand its website. Part of this development involves revisiting the text analysis research that DataLab staff conducted during the Winter 2021 startup period. DataLab is again working with BioPortal to further investigate how to leverage social media for outbreak detection. This new phase of work has two aspects: to collect data more widely (from Facebook, news aggregators, etc.); and to use more contextually sensitive language models (such as BERT and GPT-2) to analyze social media data.

Research Approach
Weather
The first step for incorporating weather monitoring into BioPortal was to find a suitable data source. This weather data needed to be free, geographically bounded, and have a readily accessible API. We ultimately settled on two sources: we used NOAA’s Weather API for current weather conditions and National Weather Service API for weather forecasts.
Next we worked on an interface to view the weather data and interpret the possible signals it could provide regarding outbreaks. One of the most common interactive map interfaces is a Javascript library called Leaflet. This library is well-documented and has a lively online community, making it easy to find solutions for implementing features.
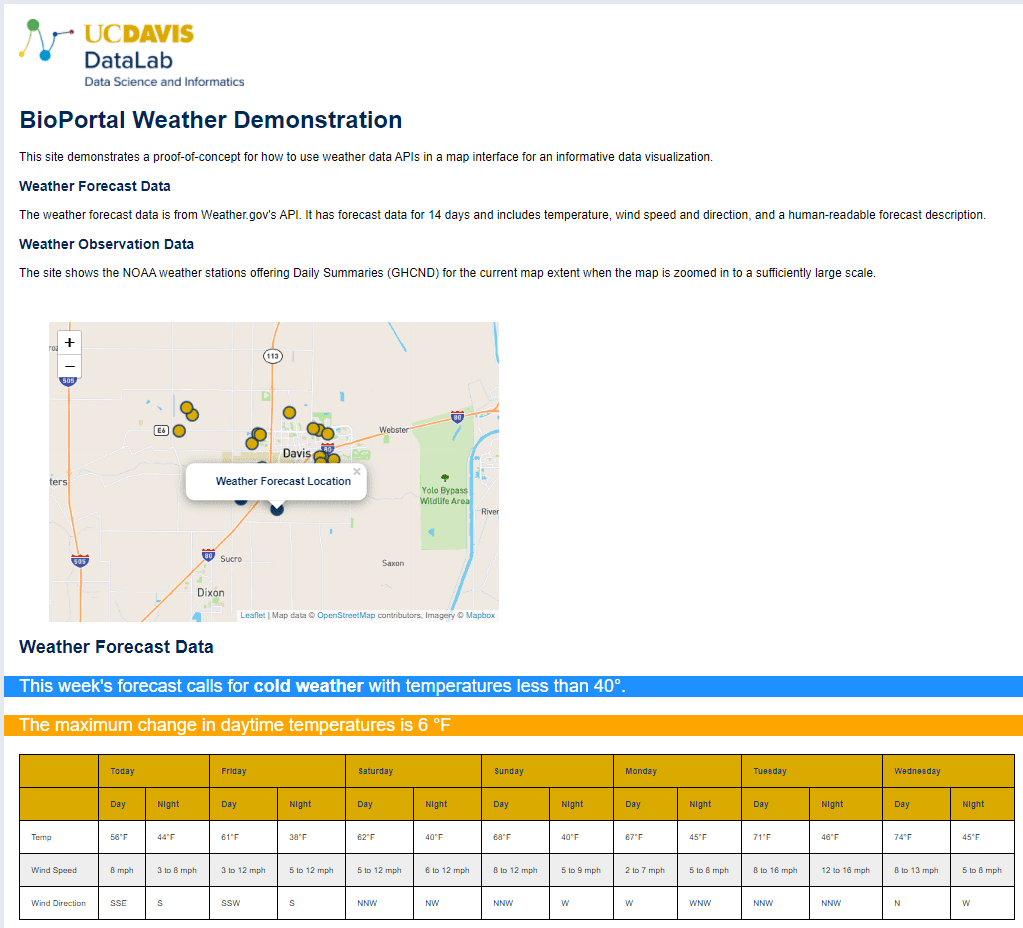
The demo website collects the relevant weather information from the APIs, and displays it on the Leaflet map. When a user starts the demo site, they are asked to move the map interface to the area they are interested in. Once a user defines a suitable area, the map triggers a call to the NOAA API to find available weather sensors in the area. Next, the map finds the relevant area for the National Weather Service forecast API, and requests the seven day forecast. The forecast is then shown in a table on the site. If certain temperature conditions are present in the forecast (if the temperature is going to be hot or cold), the website adds a banner with a warning message. The site also displays a banner stating the largest daily change in temperature for the week.
Social Media
We developed a workflow for interfacing with Twitter’s new academic research API to use as our source of social media data. One of the preliminary challenges of using Twitter for the purposes of outbreak assessment is this data’s lopsided nature: of the many tweets being sent out every day, few are about animal disease outbreaks. To identify relevant tweets, the team first developed a keyword dictionary, which contains words about domain-specific disease symptoms, farm life, and general complaints about sickness. When combined with additional search parameters, this dictionary serves as an effective filter that allows us to acquire tweets broadly related to animals and animal health.
We then needed to find ways to include geographic information. The BioPortal’s mapping tools require latitude/longitude coordinates, yet only 1-2% of these tweets are geocoded with reliable location data. To supplement this geographic information, we used user profile text to get an approximation of their location. Though there are limits to how accurate this location information ultimately is, the DataLab team determined that there is viable geographic data to be gleaned nevertheless. We passed clean profile text to the Nominatim API, which returned coordinate pairs provided by OpenStreetMap. By these means, up to 35% of collected tweets were geocoded.
The DataLab team collected ~460,000 tweets about animal disease outbreaks, which was then used to train an automated classifier that looks for new disease related tweets. After processing the content of tweets with Python’s nltk and SpaCy libraries, the team used the scikit-learn implementation of topic modeling to categorize and label tweets (labels might range from “food poisoning” and “African Swine Fever” to “COVID-19 politics”). A major point of iterative exploration centered on finding the right number of topics to model. Investigations found that smaller (20-25 possible topics) models were most effective. Once the team generated labels, they tested several classification methods and found that scikit-learn’s linear support-vector implementation had the best performance: accuracy and recall metrics averaged 97%.
To classify incoming tweets, a short Python script loads this file into memory, preprocesses the tweets, classifies them, and then produces labels that are then recorded in a data table. On the BioPortal dashboard, those labels can be associated with specific keywords or phrases (like “mad cow disease” or “farm disaster”), which BioPortal visitors can use to see whether there is chatter about disease outbreak globally, nationwide, or in nearby areas.

Outcomes
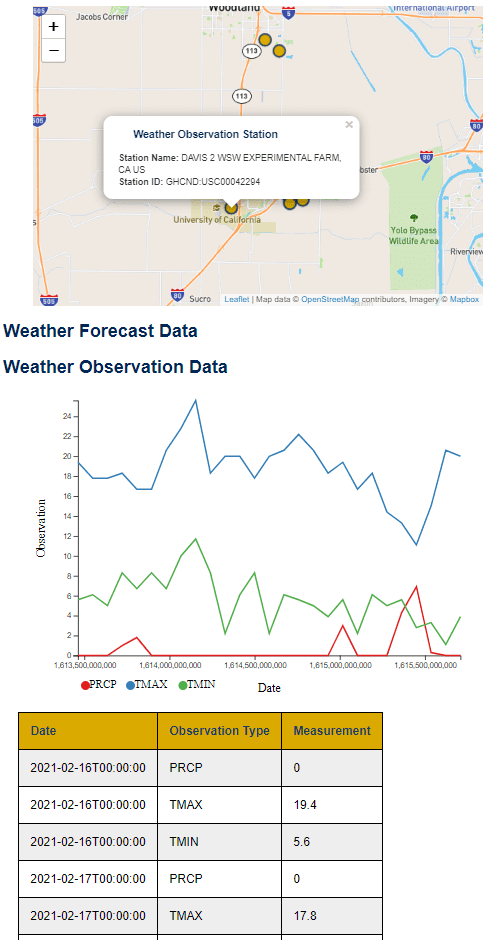
Both feature pilots resulted in usable prototypes. The weather station integration produced an interactive map which displays current and forecasted weather conditions and gives alerts when conditions are likely to induce adverse animal health. You can see a snapshot of the weather interface in Figure 1. The top of the interface shows the interactive map, which users can use to navigate to their area of interest and which displays local weather stations, while the chart below the map shows recent weather conditions. Figure 2 showcases the upcoming weather and alert system.
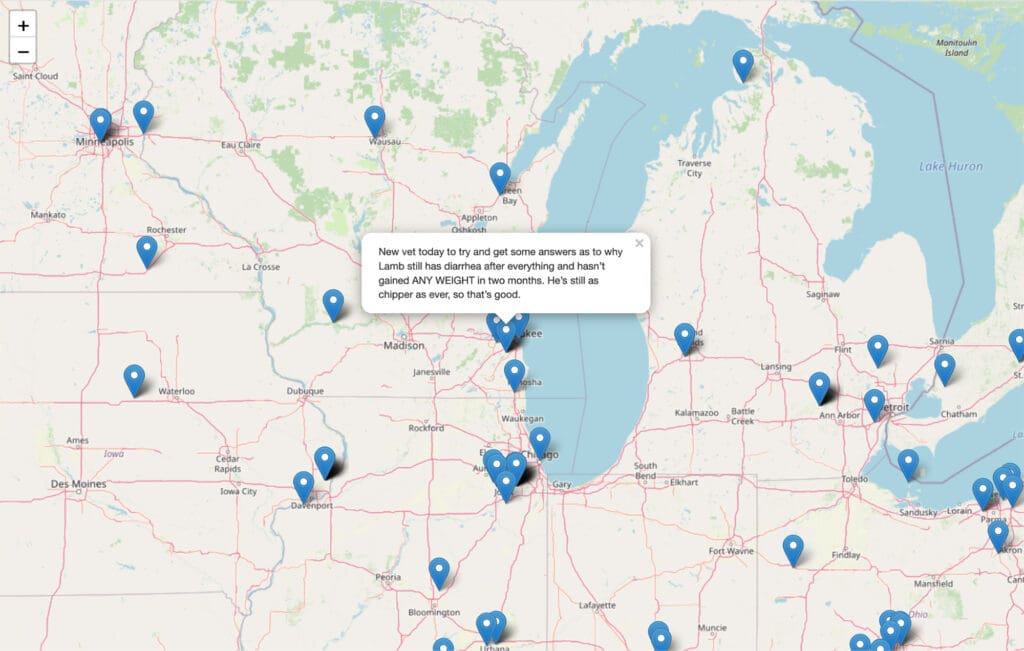
The social media features likewise bore fruit. You can see a snapshot of the social media map in Figure 3. This map drops pins on locations where tweets flagged as regarding disease originated from.
Future Directions
Both the weather and social media components of this project have room for further development. While the current prototypes are promising, the DataLab can see ready extensions to further enhance the capabilities of BioPortal. This includes both overcoming current limitations, and new feature development.

For the weather system, a clear next step in making forecast warning messages adjustable to individual farmers’ needs. Additional visualization options would also make it easier for people to interpret the site outputs. For more long term development, additional sources of weather information could be explored. Weather observation data from government sources are exclusively station-based, which means the weather observation data is bound to a discrete point location. These weather stations are not evenly distributed as there are often more stations in more populated areas. In Davis, for example, the City of Davis and the UC Davis Campus have several stations, but Winters only has one station and Dixon has none. Second, not all stations report the same data. Often stations report only one observation like temperature, while lacking others such as precipitation. If another data source can’t be found, it may also be worthwhile to implement a method for filtering observation stations that don’t report data consistently or lack measurements of interest.
An area of particular interest for expansion is developing the use of wind data and forecasts more fully. There is potential here for using or developing wind models for surface winds and researching how these could help predict or explain disease outbreaks when pathogens are windborn. This would pair especially well with the social media alerts.
The social media aspect of the project already shows great potential. The two areas that would benefit most from additional research are the identification of edge-case tweets and further refinement of the geotagging process. Both of these areas could benefit from the new features of Twitter’s academic research portal, which provides additional metadata about tweets that may be relevant to BioPortal. Twitter provides “context annotations,” which are a mix of named-entity recognition and some kind of topic modeling and which often align with large-scale, global events/entities. BioPortal may be able to use these annotations to further nuance its predictions. However, it is unclear how, exactly, these annotations are generated and more investigatory work would need to be undertaken before BioPortal could treat them as reliable indicators of an outbreak.
Team
DataLab
- Tyler Shoemaker (technical lead)