wateReview
Project Overview
wateReview is an interactive, inclusive, and collaboratively designed platform that provides a comprehensive look at the landscape of water research in Latin America and the Caribbean (LAC). Despite being the world’s most water-rich region, LAC countries face a multitude of water-related stressors. Further, they lack overarching scientific knowledge about water resources in the region, which is necessary for good decision-making and setting policies. Over the course of an unprecedented two-year study, the DataLab worked with researchers in UC Davis’s Department of Land, Air, and Water Resources (LAWR) to analyze some 20,000 research articles in English, Spanish, and Portuguese. Using this review, we determined which areas of research about water resources in LAC countries are thoroughly studied, and which ones are less so—or in other words, we determined the “bright” and “blind” spots of water research in LAC. By identifying these trends in research, wateReview serves as a resource for researchers and other stakeholders, whereby they can consult the platform to make informed decisions about undertaking future research in this part of the world.
DataLab initially assisted the LAWR researchers as part of our start-up project program. The collaboration expanded, and DataLab staff assisted with expanding the literature review, performing text analysis on the corpus of research papers, and visualizing the results in a publicly accessible way. To contextualize results from the literature review, the team used publicly available data to cluster countries into hydrosocial groups with similar social and hydrological systems. This data includes multiple metrics to measure socioeconomic factors as well as water resource abundance and use. Our clustering process allowed for more meaningful interpretation of subsequent results within and across LAC countries.
This page will serve as a brief overview of the project. Project work on wateReview extended beyond the platform itself, encompassing workshop sessions, feedback surveys from stakeholders, and more; if you would like to learn more about the project, please view the project website. You can also read the final publication on the journal website.
Research Topic Models
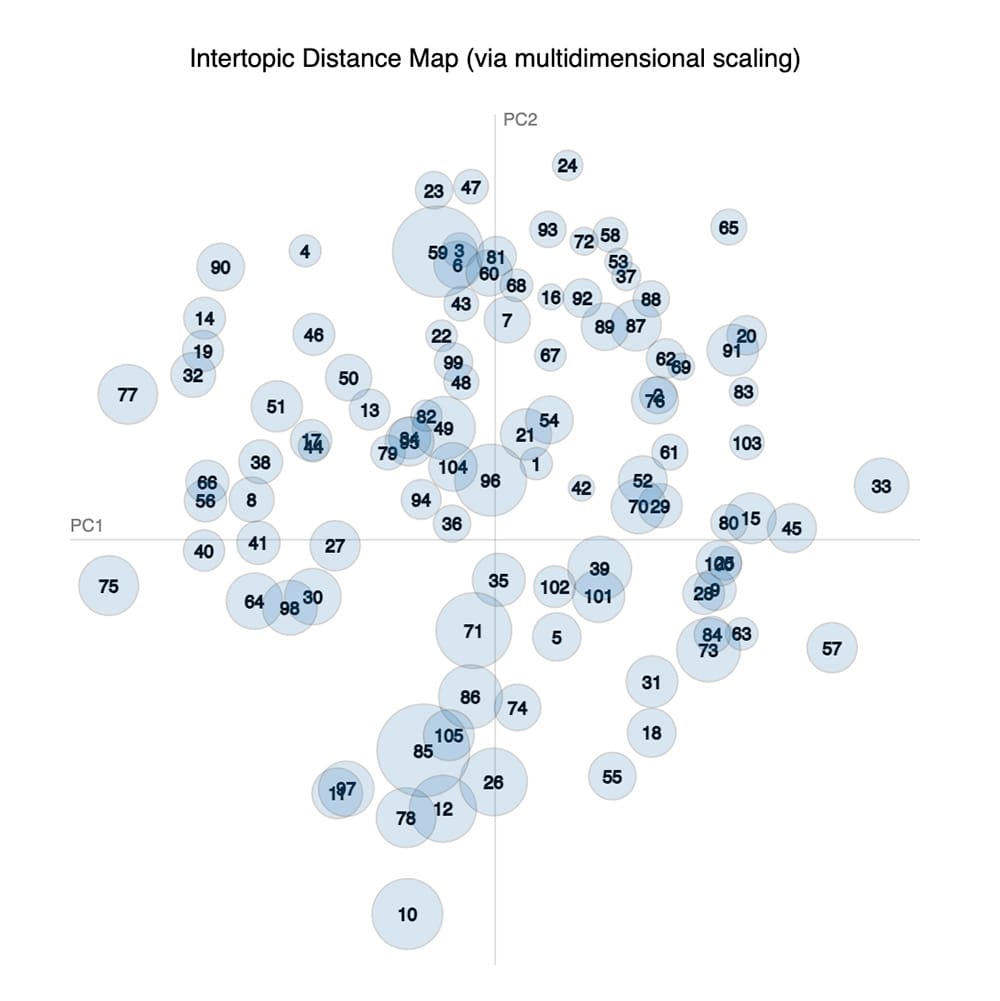
To help understand what topics were covered in previous water research, we created a series of topic models using the article corpus. A topic model is a statistical model that uses machine learning to determine the probability of correspondence between specified topics in a collection of documents. The model generates these topics on the basis of word co-occurrence. After running the model, we categorized topics into four categories: general research topics (using NSF categories), specific subfield topics, water budget topics, and method topics.
We created topic models for English, Spanish, and Portuguese. However, the English language model was more comprehensive, so it is used for the other analyses on the site. You can see a visual representation of the topic models in Figure 1, and an interactive explorer tool on the literature review tab of the wateReview website.

Country Groups
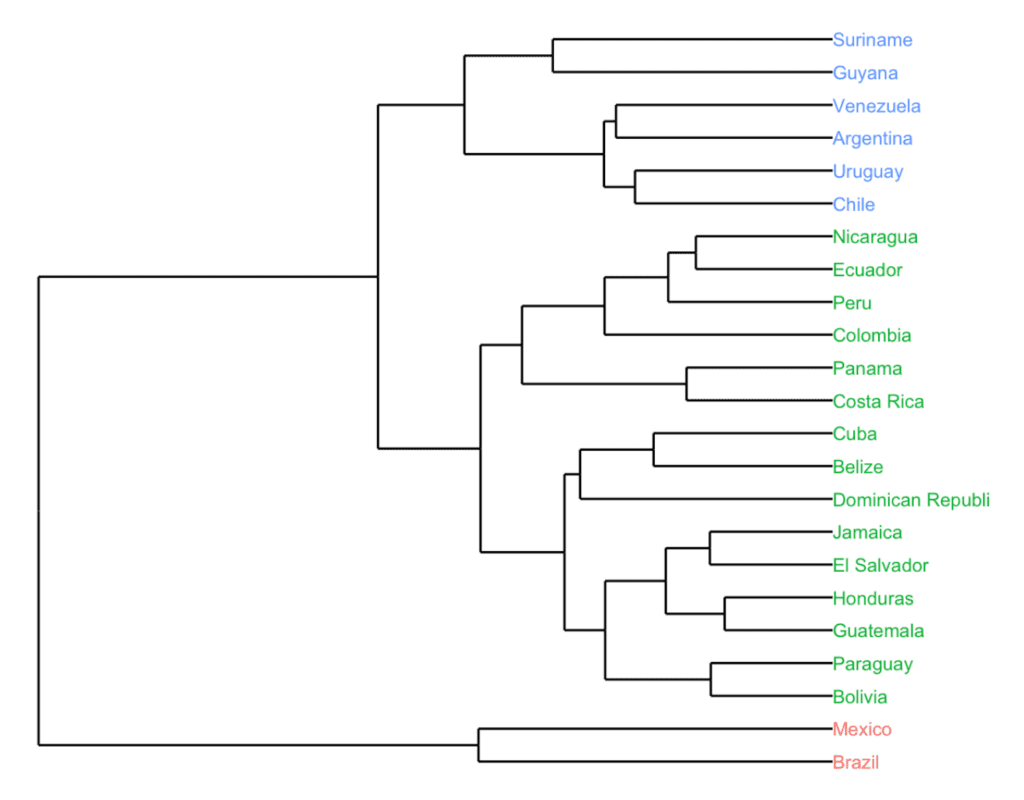
We grouped LAC countries into three hydrosocial groups based on a number of shared hydrological and social descriptors, including social and hydrological systems, socioeconomic status, and availability of water resources. These clusters were key for faceting the results of our analyses, as they allowed us to home in on specific aspects of water research in various subregions throughout LAC. Different colors represent each hydrosocial group, visible in Figure 2. You can see how similar countries within these groups are according to the descriptors by how closely they are connected in the tree structure.
More detailed information about the countries and their groups is available on the Country Groups page of the wateReview website, including other interactive visualizations and individual cards with information about each country.

Bright/Blind Spots
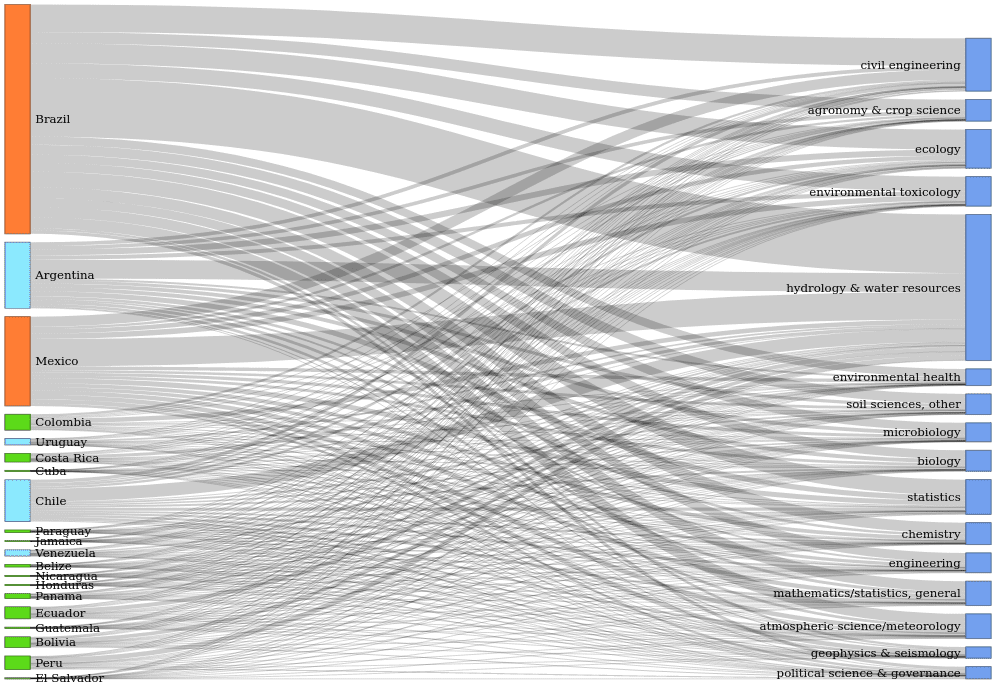
With the country clusters identified, we could investigate which areas of research are most and least prominent. We wanted to show what is being studied, where, and in what amount in a way that was easily comparable. An example visualization is shown in Figure 3. This Sankey diagram shows the countries in our corpus, and the common water research topics. The width of the stream connecting the country and topic shows the prevalence of that topic in that country’s research output. An interactive version of these figures and others may be found on the Bright/Blind spots page.

Research Connectivity
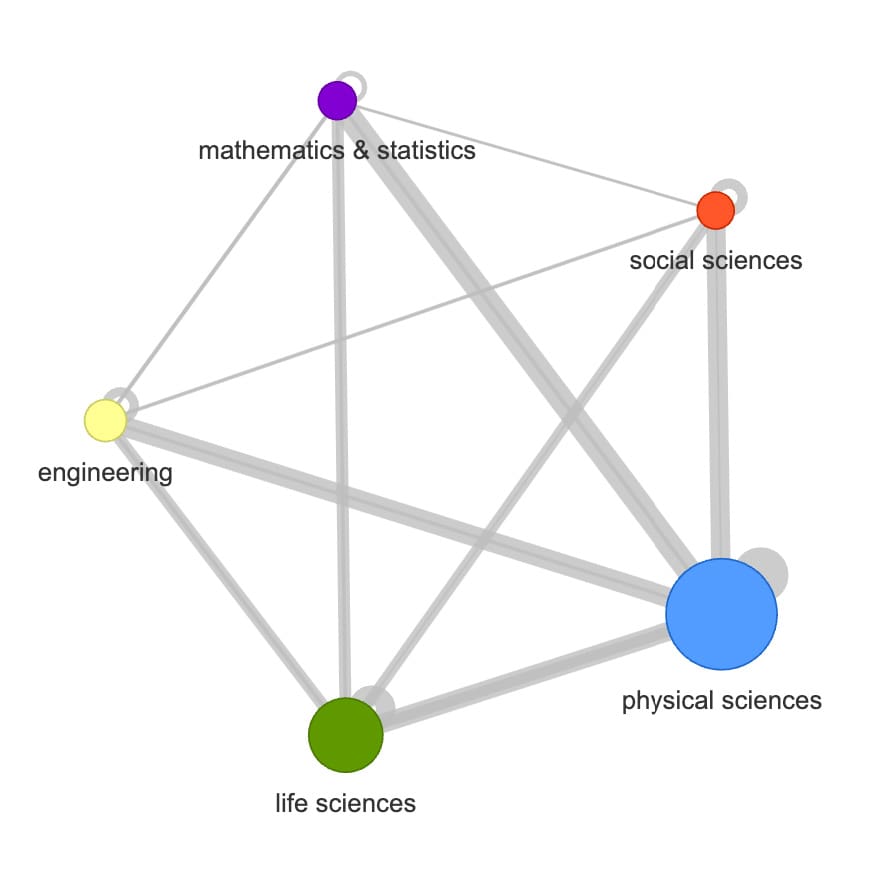
The last set of visualizations cover how various aspects of the research corpus are related to each other. Here we visualize how research papers cite each other between countries, themes, and policies. In these plots, the topics of interest are circles, where the size indicates the research volume, and the ties between them are scaled for the number of citations between papers focused on those topics. For example, in Figure 4, you can see that while much of the water research in our corpus cites within the physical sciences, there is little cross citation between the social sciences and mathematics & statistics. You can see all of the connectivity plots under the Research Connectivity tab on the wateReview website.

DataLab Contacts
- Tyler Shoemaker and Arthur Koehl (technical lead)